
A collaboration of the Colorado Evaluation and Action Lab, the 18th Judicial District Attorney's Office, and the Loyola Chicago Center for Criminal Justice — a project of the Prosecutorial Performance Indicators.
The fair and just treatment of all communities at each stage of the criminal justice process is of significant importance. Central to this discourse is a recognition of the discretionary power that prosecutors wield in shaping the outcomes of criminal cases. This includes, among other things, the decision to prosecute or decline to file charges, adjust the severity of charges, dispose of cases through dismissal, deferral, or plea negotiations, and make sentencing recommendations. It is valuable to examine such points of discretion to understand whether there are differences in outcomes across individuals of different races/ethnicities.
Colorado's 18th District Attorney's (DA) Office data dashboard, released in September 2022, provides a diagnostic tool to identify what is happening. However, if we see differences, for example, between White and Black individuals, what does that tell us?
Digging Deeper. What do Differences Mean?
To support actionability, it is important to dig deeper, distinguishing between two important concepts — disproportionality and disparity — and considering system drivers of potential differences.
Disproportionality. The DA's Office receives cases after law enforcement agencies make an arrest. Disproportionality exists when more people of a certain race/ethnicity are arrested than we would expect given the population. Race and ethnicity are captured separately in the census and the DA's case management system. The DA's case management system is limited in that individuals cannot be identified as multiracial, and it is rare that both the race and ethnicity for an individual are recorded. To help address this limitation and support an equitable approach, which aims to review and present data in ways that align with how individuals identify (Pew Research Center, Schusterman Family Philanthropies), we have combined the race and ethnicity fields.
When looking at cases referred to the 18th Judicial District Attorney's Office between January 2018 and June 2022, we see the following with regard to disproportionality:
With regard to Hispanic individuals:
- If only considering ethnicity, 16.5% of individuals in Arapahoe, Douglas, Lincoln and Elbert counties identify as Hispanic. This compares with 16.8% of individuals referred to the DA's Office.
- When considering race and ethnicity together, data suggest that 9% of individuals in Arapahoe, Douglas, Lincoln and Elbert counties identify primarily as Hispanic (whereas 6.4% identify as Hispanic + multiracial and 0.9% identify as Hispanic + Black, Native American, or Asian; therefore, are represented in those categories). This compares with 16.7% of individuals referred to the DA's Office.
With regard to Black individuals:
- When considering race and ethnicity together, 7% of individuals in Arapahoe, Douglas, Lincoln and Elbert counties identify as Black. This compares with 17.3% of individuals referred to the DA's Office.
Any decisions made by the DA's Office are downstream from the first decision in criminal case processing: who is arrested. Where there are racial disproportionalities in the raw number of people arrested, it follows that those disproportionate numbers flow throughout the prosecution process.
Disproportionality may not necessarily be explained by differences in criminal behavior. It can also be due to the behavior of criminal justice actors, like law enforcement practices and resource allocation that result in more people of color being stopped and arrested, or crime trends and enforcement responses in certain neighborhoods.
Disparity. Disparity exists when people who should be treated the same are treated differently. As noted, the current data dashboard presents raw differences. Any differences we see could be the result of differences in cases (e.g., severity of charges), defendants (e.g., criminal history), and/or prosecutorial practices. To support understanding and actionability, it is important to compare similarly situated defendants and similar types of cases. This will help us understand the extent of, and potential reasons for, any disparities.
Systemic Drivers of Disparities. Appropriately, prosecutors evaluate each case on its own merits. While decisions and criteria used to make decisions may seem unrelated to race on a case-by-case basis, they may be influenced by systemic drivers that are correlated with a defendant's race/ethnicity (Figure 1, below). For example, Black and Hispanic defendants, due to historical inequities, may have unequal access to resources such as educational opportunities, formal medical diagnoses, and steady employment. These circumstances could influence factors that prosecutors consider in their decision-making, such as previous criminal history, ability to pay restitution, or engagement in drug treatment.
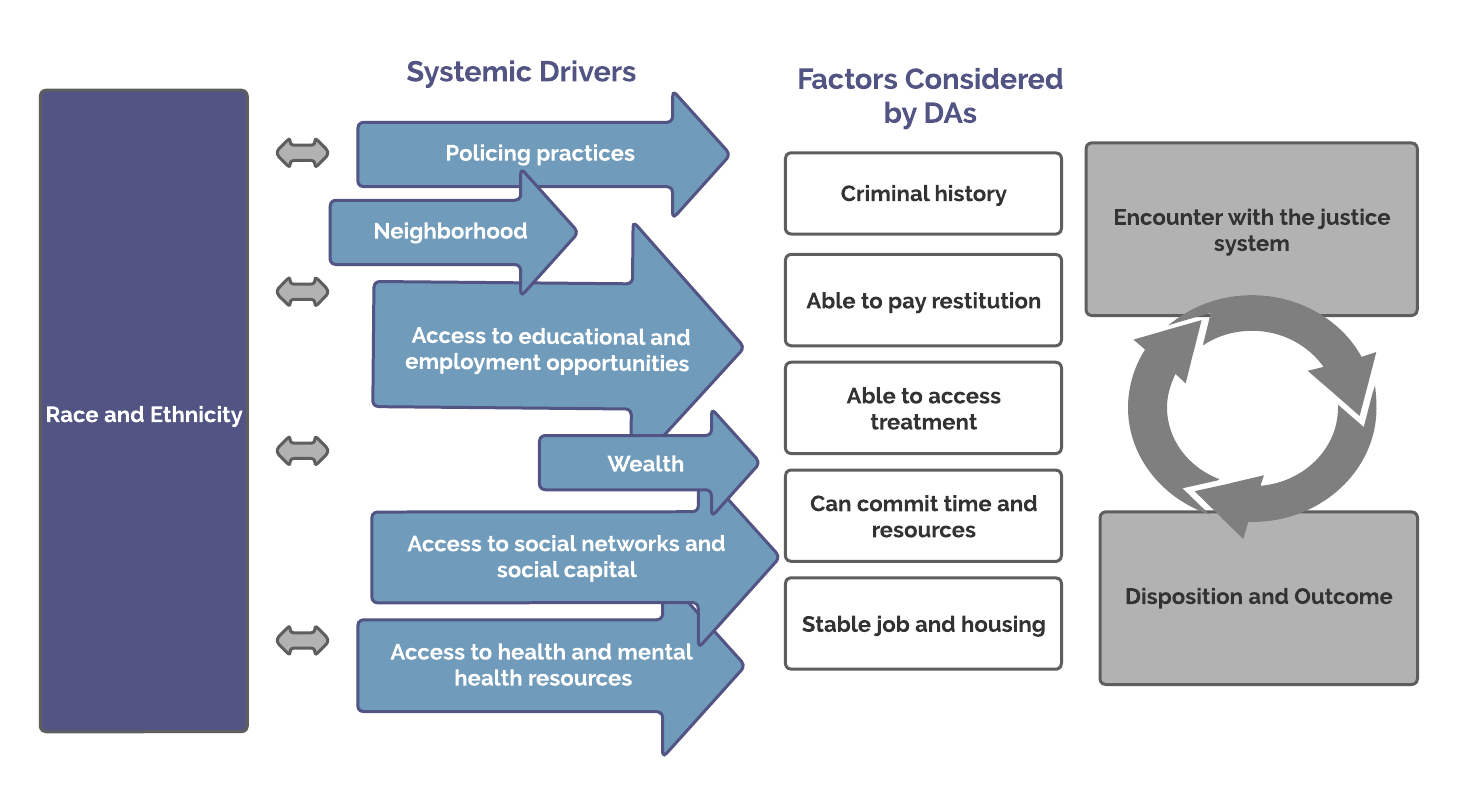
Figure 1. Examples of Systemic Drivers of Racial/Ethnic Disparities
Likewise, prosecutors may have different interpretations of defendants' life circumstances and experiences. Defendants may have diverse expressions of concepts such as remorse, respect, or compliance, which may or may not align with prosecutors' expectations. Likewise, prosecutors may differ in their interpretation of a defendant's life circumstances, attitudes, or behaviors. Importantly, our methodology cannot be used to support or refute possible implicit or explicit bias.
We hope this analysis will prompt a conversation about what systemic drivers of racial/ethnic disparities exist and how a DA's Office might work to address them. In reviewing the results we encourage you to take a systemic perspective, considering the variety of potential drivers noted above.
Analysis Focus
This analysis focused on the outcomes of prosecutorial decision making in the DA's Office from January 2018 through the end of June 2022. We assessed the extent of racial and ethnic disparities across the following four decision points: (1) declination of felony referrals; (2) dispositions (dismissal, deferred judgment, and plea agreement) for felony and misdemeanor offenses; (3) charge reduction from filing to disposition for felony and misdemeanor cases; and (4) imposition of an incarceration sentence (Figure 2, below). We prioritized the areas where the DA's Office has the greatest direct influence and where we had accurate and reliable data.
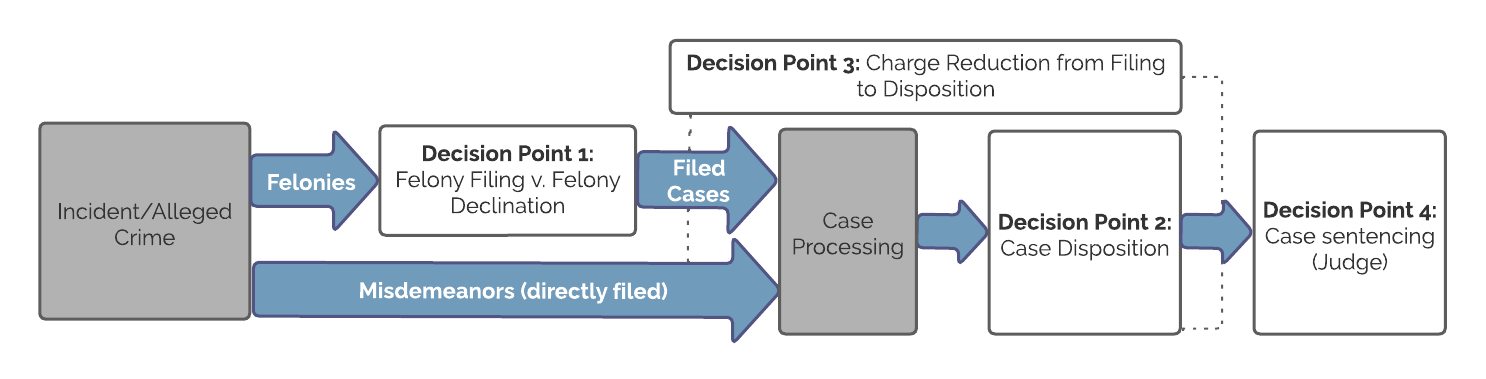
Figure 2. Decision Points Analyzed
A more comprehensive overview of how a case moves through the system can be found here.
As noted above, for this analysis, we combined the race and ethnicity fields. Due to known challenges in accurately collecting Hispanic ethnicity, we used defendants' last name, linked with census data, to help us better identify Hispanic individuals. See Terms, Methods, and Limitations for more information.
This analysis aims to prompt discussion and raise questions, rather than provide definitive answers. To support this aim, we present results as predicted probabilities: an estimate of the likelihood of the outcome, based on the defendant's race/ethnicity, while taking into account individual and case factors. Information on statistical significance, which is heavily influenced by sample size, can be found in the technical appendix.
Key Takeaways
Our data shows that Black defendants have a slightly higher dismissal rate than Hispanic or White defendants. Unfortunately, we don't currently capture data to identify the reason why the case was dismissed.
This research indicates that White defendants have a slightly higher rate of having their case declined than Black or Hispanic defendants. While a case might be declined for a variety of different reasons, our office has not historically captured data on the reason or type of cases where we declined to file charges.
Our analysis shows that Hispanic defendants are more likely to plead guilty, and more likely to face incarceration than Black and White defendants. At this time, the data does not tell us why that is the case.
Actionability
Our office will begin tracking broad categories to identify the reason a case is dismissed. We have already begun work with our technical team to build the capacity to capture and analyze this information. This will help us better understand if dismissals are occurring because of issues like lack of witness cooperation, lack of evidence, evidence being suppressed, or some other issue.
Our office currently doesn't track the reason a case is not filed, nor do we track the charges that law enforcement had recommended. We will implement process changes and technology improvements to allow us to capture both the highest charge recommended by law enforcement, and the reason a reviewing prosecutor declined to file the case so we can better evaluate the reasons behind this data.
Hispanic defendants may face additional challenges in accessing the justice system due to language or cultural barriers. Our office will engage with community partners and institute internal training to ensure that language barriers are not a barrier to equal justice.
We will continue to provide and require our prosecutors and staff to participate in training on the disparities reflected in this report as well as implicit bias training.
Felony Declination
The DA's Office decides whether or not to prosecute felony referrals — formal accusations that a specific person has committed a specific crime. In this section, we consider instances where the DA's Office has declined to file charges following a felony referral.
In the 18th Judicial District, 22,896 felony referrals were made for White, Black, and Hispanic individuals from January 1, 2018 to June 30, 2022. The DA's Office declined to file charges for 8.1% (1,857) of these. The Office declined to file charges in 8.5% (1,097) of felony referrals involving White individuals, 8.1% (447) involving Black individuals, and 6.9% (313) involving Hispanic individuals. These represent raw rates: any differences we see could be due to differences in individual or case characteristics.
Predicted Probability of Felony Declination. After controlling for defendant gender, age, and criminal history, the predicted probability of having a felony referral declination was 8.5% for White individuals, 7.9% for Black individuals, and 7.2% for Hispanic individuals. These estimates aim to take into account potential differences in individual characteristics.
- Individuals without a criminal history or a less serious criminal history, as well as younger individuals (under age 18), were more likely to have their felony referral declined.
- Since charge information was not available for declined cases, we were not able to consider charge type or charge severity.
Outcome: Felony Declination (All)
The results account for differences in individual characteristics.
In Arapahoe County, after controlling for individual characteristics, the predicted probability of having a felony referral declination was 8.0% for White individuals, 7.5% for Black individuals, and 6.5% for Hispanic individuals.
Outcome: Felony Declination (Arapahoe County)
The results account for differences in individual characteristics.
In Douglas County, after controlling for individual characteristics, the predicted probability of having a felony referral declination was 10.1% for Black individuals, 9.8% for White individuals, and 9.6% for Hispanic individuals.
Outcome: Felony Declination (Douglas County)
The results account for differences in individual characteristics.
Disposition
The rest of the analysis considers felonies and misdemeanors filed between January 1, 2018 to June 30, 2022 for individuals identified as White, Black, or Hispanic. Our sample includes 88,841 cases that were disposed of during that time frame. The racial/ethnic breakdown of defendants in our sample was: 64.3% White (57,146), 18.3% Black (16,263), and 17.4% Hispanic (15,432).
Case outcomes. Of the cases in our sample, 68.5% were resolved through plea agreements, 19.8% through dismissal, 6.8% through deferred judgments, 3.8% through a global plea, and 1.0% through a trial. Systematic data on other outcomes, such as diversion, are not available.
Differences Among Defendants. There were some differences among defendants. Hispanic and Black individuals were younger than White individuals. White individuals were less likely to have a criminal history. Black individuals had slightly higher rates of having cases involving a felony charge (vs. misdemeanor) filed. It took longer to resolve cases for Black individuals.
More on differences among defendants
- Age and gender: In general, Hispanic and Black individuals were younger than White individuals. For example, 38.6% of Hispanic individuals and 36.4% of Black individuals were under the age of 26, compared to 30.5% of White individuals. Black individuals (74.6%) and Hispanic individuals (73.2%) were more likely to be male, compared to White individuals (70.3%).
- Criminal history: White individuals were less likely to have a criminal history. 72.2% of White individuals had no prior convictions, compared to 69.4% of Hispanic individuals and 61.8% of Black individuals. A greater proportion of Black individuals (20.5%) had prior misdemeanor convictions only, compared to Hispanic (18.4%) and White (18.1%) individuals. A greater proportion of Black individuals (17.7%) had prior felony convictions, compared to Hispanic (12.2%) and White (9.7%) individuals.
- Charge level and charge type: Cases involving Black individuals were more likely to include a felony charge (23.6%), compared to those involving Hispanic (18.8%) and White (15.1%) individuals. In looking at charge type, cases involving Black individuals had a higher percentage of person or sex charges. Cases involving White individuals had a higher percentage of DUI charges. Cases involving Hispanic individuals had a higher percentage of traffic charges.
- Case length: It took longer to resolve cases for Black individuals, with a mean of 5.7 months (standard deviation [SD]: 6.3), compared to 4.8 months for Hispanic individuals (SD: 5.7) and 4.3 months for White individuals (SD: 5.2).
Dismissal
A case is dismissed when the criminal charges are terminated, either by the court or by the prosecutor. There can be several reasons why a case is dismissed, including: a lack of evidence or unavailability of a witness. Cases may also be noted as dismissed if they are referred to, or successfully complete, a diversion program.
Total Dismissed. Our sample included 17,619 cases that were dismissed. Dismissals accounted for 19.8% of case dispositions in the sample. Overall, 22.7% (3,688) of cases involving Black individuals, 19.6% (11,212) involving White individuals, and 17.6% (2,719) involving Hispanic individuals were dismissed. These represent raw rates: any differences we see could be due to differences in individual or case characteristics.
Predicted Probability of Dismissal. After controlling for defendant age, gender, criminal history, case length, disposition quarter, charge type, and charge class, the predicted probability of dismissal was 23.9% for Black individuals, 19.1% for White individuals, and 18.3% for Hispanic individuals. These estimates aim to take into account potential differences in individual or case characteristics.
Dismissals and Case Length. The longer a case took, the higher the likelihood of dismissal. Recall that it took longer to resolve cases for Black individuals.
To further explore potential differences across races/ethnicities we zoomed in on dismissals by charge level (misdemeanor and felony), dismissals by the charge types most frequently dismissed (person or sex offenses and traffic), and dismissals by county.
Outcome: Dismissal (All)
The results account for differences in individual and case characteristics.
Dismissals by Charge Level: Cases involving a misdemeanor charge were more likely to result in a dismissal (22.1%) than cases involving a felony charge (8.8%). For misdemeanors, after controlling for individual and case characteristics, the predicted probability of dismissal was 26.4% for Black individuals, 21.5% for White individuals, and 20.6% for Hispanic individuals. A similar pattern was seen for cases involving a felony charge.
Outcome: Dismissal (Misdemeanor)
The results account for differences in individual and case characteristics.
Dismissals for Person or Sex Offenses: Cases involving person or sex charges were also more likely to result in a dismissal: 27.3% of these cases were dismissed across races/ethnicities. After controlling for individual and case characteristics, the predicted probability of dismissal was 32.2% for Black individuals, 26.7% for White individuals, and 22.7% for Hispanic individuals.
Outcome: Dismissal (Person or Sex Offenses)
The results account for differences in individual and case characteristics.
Dismissals for Traffic Offenses: Cases involving traffic charges were more likely to result in a dismissal: 21.6% of these cases were dismissed across races/ethnicities. After controlling for individual and case characteristics, the predicted probability of dismissal was 26.3% for Black individuals, 20.7% for White individuals, and 20.6% for Hispanic individuals.
Outcome: Dismissal (Traffic Offenses)
The results account for differences in individual and case characteristics.
For cases involving the most frequent charge, "Driving Under Restraint/Revoked License", after controlling for individual and case characteristics, the predicted probability of dismissal was 23.6% for Black individuals, 20.9% for White individuals, and 17.8% for Hispanic individuals. A similar pattern was seen for cases involving the second most common charge, "Driving without Insurance".
Outcome: Dismissal ("Driving Under Restraint/Revoked License" Charge)
The results account for differences in individual and case characteristics.
Dismissal by County: In Douglas county, after controlling for individual and case characteristics, the predicted probability of dismissal was 17.4% for Black individuals, 16.4% for White individuals, and 14.7% for Hispanic individuals.
Outcome: Dismissal (Douglas County)
The results account for differences in individual and case characteristics.
In Arapahoe county, after controlling for individual and case characteristics, the predicted probability of dismissal was 25.4% for Black individuals, 21.7% for White individuals, and 19.7% for Hispanic individuals.
Outcome: Dismissal (Arapahoe County)
The results account for differences in individual and case characteristics.
Deferred Judgment
A deferred judgment is an alternative to traditional prosecution that attempts to address individuals' needs and to offer alternatives such as useful public service, probation, payment of restitution, or counseling or treatment related to their case. The defendant enters a temporary guilty plea, and, if they comply with the terms, their guilty plea is withdrawn and the case is dismissed.
Total Deferred. Deferrals accounted for 6.8% of case dispositions in the sample. Overall, a higher share of cases involving White individuals were deferred compared to Black and Hispanic individuals. These represent raw rates: any differences we see could be due to differences in individual or case characteristics.
Predicted Probability of Deferral. After controlling for defendant age, gender, criminal history, charge class, charge type, case length, and disposition quarter, the predicted probability of a case resulting in deferral was 7.7% for White individuals, 5.5% for Hispanic individuals, and 5.1% for Black individuals. These estimates aim to take into account potential differences in individual or case characteristics.
To further explore potential differences across races/ethnicities we zoomed in on deferrals by charge level (misdemeanors and felonies), charge type, and county.
Outcome: Deferred Judgment (All)
The results account for differences in individual and case characteristics.
Deferrals by Charge Level: Cases involving a felony charge were more likely to result in a deferral (16.2%) than cases involving a misdemeanor charge (4.9%). For felonies, after controlling for individual and case characteristics, the predicted probability of deferral was 18.9% for White individuals, 13.2% for Hispanic individuals, and 12.3% for Black individuals. A similar trend was observed for cases involving misdemeanor charges.
Outcome: Deferred Judgment (Felonies)
The results account for differences in individual and case characteristics.
Deferrals for Person or Sex Offenses: Cases involving person or sex charges were likely to result in deferral: 18.3% of these cases were deferred across races/ethnicities. After controlling for individual and case characteristics, the predicted probability of deferral was 20.4% for White individuals, 15.5% for Hispanic individuals, and 13.8% for Black individuals.
Outcome: Deferred Judgment (Person or Sex Offenses)
The results account for differences in individual and case characteristics.
Deferral by County: In Douglas county, after controlling for individual and case characteristics, the predicted probability of a case resulting in deferral was 10.1% for White individuals, 8.5% for Black individuals, and 8.2% for Hispanic individuals.
Outcome: Deferred Judgment (Douglas County)
The results account for differences in individual and case characteristics.
In Arapahoe county, after controlling for individual and case characteristics, the predicted probability of deferral was 6.1% for White individuals, 4.6% for Hispanic individuals, and 4.4% for Black individuals.
Outcome: Deferred Judgment (Arapahoe County)
The results account for differences in individual and case characteristics.
Plead Guilty
An individual pleads guilty when they admit a factual basis for the plea and acknowledge guilt for a charge, sometimes in exchange for a more lenient sentence.
Total Plead Guilty: Our sample included 60,483 cases that resulted in a guilty plea. Guilty pleas accounted for 68.5% of case dispositions in the sample. Overall, 73.1% (11,284) of cases involving Hispanic individuals, 68.4% (39,062) of cases involving White individuals, and 64.9% (10,546) of cases involving Black individuals resulted in a guilty plea. These represent raw rates: any differences we see could be due to differences in individual or case characteristics.
Predicted Probability of Pleading Guilty. After controlling for defendant age, gender, criminal history, charge class, charge type, case length, and disposition quarter, the predicted probability of a case resulting in a guilty plea was 72.0% for Hispanic individuals, 68.5% for White individuals, and 65.5% for Black individuals. These estimates aim to take into account potential differences in individual or case characteristics.
Plead Guilty and Case Length: The longer a case took, the lower the likelihood of a case resulting in a guilty plea. Recall that it took longer to resolve cases for Black individuals.
To further explore potential differences across races/ethnicities we zoomed in on guilty pleas by charge level (misdemeanors and felonies), guilty pleas by the charge types most frequently plead to (DUIs, traffic, and drug offenses), and guilty pleas by county.
Outcome: Plead Guilty (All)
The results account for differences in individual and case characteristics.
Plead Guilty by Charge Level: Cases involving felony and misdemeanor charges were similarly likely to result in a guilty plea, 69.5% and 68.3% respectively. For felonies, after controlling for individual and case characteristics, the predicted probability of a case resulting in a guilty plea was 74.7% for Hispanic individuals, 69.5% for Black individuals, and 67.7% for White individuals.
Outcome: Plead Guilty (Felonies)
The results account for differences in individual and case characteristics.
For misdemeanors, after controlling for individual and case characteristics, the predicted probability of a case resulting in a guilty plea was 71.3% for Hispanic individuals, 68.6% for White individuals, and 64.4% for Black individuals.
Outcome: Plead Guilty (Misdemeanor)
The results account for differences in individual and case characteristics.
Plead Guilty for Driving Under the Influence (DUI) Offenses: Cases involving DUI charges were more likely to result in a guilty plea: 88.0% of these cases resulted in a guilty plea across races/ethnicities. After controlling for individual and case characteristics, the predicted probability of a guilty plea was 88.3% for White individuals, 87.7% for Hispanic individuals, and 86.4% for Black individuals.
Outcome: Plead Guilty (Driving Under the Influence (DUI) Offenses)
The results account for differences in individual and case characteristics.
Plead Guilty for Traffic Offenses: Cases involving traffic charges were likely to result in a guilty plea: 76.0% of these cases resulted in a guilty plea across races/ethnicities. After controlling for individuals and case characteristics, the predicted probability of a guilty plea was 77.6% for Hispanic individuals, 76.9% for White individuals, and 70.8% for Black individuals.
Outcome: Plead Guilty (Traffic Offenses)
The results account for differences in individual and case characteristics.
For cases involving the most frequent charge, "Driving Under Restraint/Revoked License", after controlling for individual and case characteristics, the predicted probability of a guilty plea was 79.2% for Hispanic individuals, 74.4% for White individuals, and 71.2% for Black individuals. A similar trend was seen for cases involving the second most frequent charge, "Driving without Insurance".
Outcome: Plead Guilty ("Driving Under Restraint/Revoked License" Charge)
The results account for differences in individual and case characteristics.
Plead Guilty for Drug Offenses: Cases involving drug charges were also likely to result in a guilty plea: 72.3% of these cases resulted in a guilty plea across races/ethnicities. After controlling for individuals and case characteristics, the predicted probability of a guilty plea was 76.9% for Hispanic individuals, 72.5% for Black individuals, and 71.1% for White individuals.
Outcome: Plead Guilty (Drug Offenses)
The results account for differences in individual and case characteristics.
Plead Guilty by County: In Douglas county, after controlling for individual and case characteristics, the predicted probability of a guilty plea was 74.4% for Hispanic individuals, 70.5% for Black individuals, and 70.2% for White individuals.
Outcome: Plead Guilty (Douglas County)
The results account for differences in individual and case characteristics.
In Arapahoe county, after controlling for individual and case characteristics, the predicted probability of a guilty plea was 70.8% for Hispanic individuals, 66.8% for White individuals, and 64.1% for Black individuals.
Outcome: Plead Guilty (Arapahoe County)
The results account for differences in individual and case characteristics.
Charge Reduction
After a prosecutor files a case, the top charge in the case may change over time as some charges are dismissed or amended between filing and disposition. In this section, we considered reductions in the severity of charges from initial filing to disposition for cases that plead or were found guilty.
Total Charge Reduction: Of the 60,892 cases that resulted in a guilty plea, 33.9% had no charge reduction, 16.4% had a within charge level reduction (either from a more severe felony to a less severe felony, or from a more severe misdemeanor to a less severe misdemeanor), and 49.8% were reduced across charge levels (from a misdemeanor to a petty offense/infraction or from a felony to misdemeanor or petty offense/infraction). Overall, the breakdown across racial/ethnic groups was:
- No reduction: 35.3% Hispanic (3,980), 33.6% White (13,127), and 33.4% Black (3,521).
- Within charge level reduction: 19.7% Black (2,078), 18.7% Hispanic (2,106), and 14.8% White (5,788).
- Across charge level reduction: 51.6% White (20,147), 46.9% Black (4,947), and 46.1% Hispanic (5,198).
These represent raw rates: any differences we see could be due to differences in individuals or case characteristics.
Predicted Probability of Charge Reduction: After controlling for defendant age, gender, criminal history, charge class, charge type, case length, disposition quarter, and whether the referred charge was reduced at filing, the predicted probability of no charge reduction was 36.3% for Hispanic individuals, 33.5% for White individuals, and 33.1% for Black individuals.
Outcome: Within Charge Level Reduction (All)
The results account for differences in individual and case characteristics.
The predicted probability of within charge level reduction was 18.1% for Hispanic individuals, 16.6% for Black individuals, and 15.8% for White individuals.
Outcome: Within Charge Level Reduction (All)
The results account for differences in individual and case characteristics.
The predicted probability of across charge level reduction was 50.8% for White individuals, 50.4% for Black individuals, and 45.6% for Hispanic individuals. These estimates aim to take into account potential differences in individual or case characteristics.
To further explore potential differences across races/ethnicities, we zoomed in on charge reduction by charge types most frequently reduced (drug and traffic offenses) and charge reduction by county.
Outcome: Across Charge Level Reduction (All)
The results account for differences in individual and case characteristics.
Charge Reduction for Drug Offenses: After controlling for individual and case characteristics, the predicted probability of across charge level reduction (reduction from a misdemeanor to a petty offense/infraction or from a felony to misdemeanor or petty offense/infraction) for cases involving drug charges was 15.4% for White individuals, 13.2% for Hispanic individuals, and 12.2% for Black individuals.
Outcome: Charge Reduction: Drug Offenses
The results account for differences in individual and case characteristics.
Charge Reduction for Traffic Offenses: After controlling for individual and case characteristics, the predicted probability of across charge level reduction (reduction from a misdemeanor to a petty offense/infraction or from a felony to misdemeanor or petty offense/infraction) for cases involving traffic charges was 69.6% for White individuals, 67.2% for Black individuals, and 60.8% for Hispanic individuals.
Outcome: Charge Reduction: Traffic Offenses
The results account for differences in individual and case characteristics.
Charge Reduction by County: In Douglas county, after controlling for individual and case characteristics, the predicted probability of across charge level reduction (reduction from a misdemeanor to a petty offense/infraction or from a felony to misdemeanor or petty offense/infraction) was 57.1% for White individuals, 55.6% for Black individuals, and 51.9% for Hispanic individuals.
Outcome: Charge Reduction (Douglas County)
The results account for differences in individual and case characteristics.
In Arapahoe county, after controlling for individual and case characteristics, the predicted probability of across charge level reduction (reduction from a misdemeanor to a petty offense/infraction or from a felony to misdemeanor or petty offense/infraction) was 48.0% for Black individuals, 46.6% for White individuals, and 42.7% for Hispanic individuals.
Outcome: Charge Reduction (Arapahoe County)
The results account for differences in individual and case characteristics.
Sentenced to Incarceration
After an individual is found guilty of a crime, a judge imposes a sentence which may include fees, fines, community service, probation, jail, community corrections, or prison. Prosecutors and defense attorneys can negotiate plea bargains or make sentencing recommendations to the judge, who decides on the ultimate sentence. Incarceration includes any jail sentence (with or without probation), community corrections, or prison.
Total Incarceration: Of the 60,892 cases that resulted in a guilty plea, 12.5% had an incarcerative sentence. Overall, 14.6% (1,537) of cases involving Black individuals, 12.9% (1,453) of cases involving Hispanic individuals, and 11.8% (4,607) of cases involving White individuals resulted in an incarcerative sentence. These represent raw rates: any differences we see could be due to differences in individual or case characteristics.
Predicted Probability of Incarceration. After controlling for defendant age, gender, criminal history, charge class, charge type, case length, and disposition quarter, the predicted probability of an incarcerative sentence was 13.1% for Hispanic individuals, 12.5% for White individuals, and 11.8% for Black individuals. These estimates aim to take into account potential differences in individual or case characteristics.
To further explore potential differences across races/ethnicities, we zoomed in on incarcerative sentences by charge level (felonies), the charge types most frequently incarcerated (property and DUI offenses), and county.
Outcome: Incarceration (All)
The results account for differences in individual and case characteristics.
Incarceration by Charge Level. Cases involving a conviction for a felony charge were more likely to result in an incarcerative sentence (40.1%) than cases involving a conviction for a misdemeanor charge (6.6%). For felonies, after controlling for individual and case characteristics, the predicted probability of an incarcerative sentence was 40.9% for Hispanic individuals, 40.5% for White individuals, and 38.3% for Black individuals.
Outcome: Incarceration (Felonies)
The results account for differences in individual and case characteristics.
Incarceration for Property Offenses. Cases involving property charges were more likely to result in an incarcerative sentence: 30.8% of these cases resulted in an incarcerative sentence across races/ethnicities. After controlling for individual and case characteristics, the predicted probability of an incarcerative sentence for property cases was 31.5% for White individuals, 31.5% for Hispanic individuals, and 28.1% for Black individuals.
Outcome: Incarceration (Property Offenses)
The results account for differences in individual and case characteristics.
Incarceration for Driving Under the Influence (DUI) Offenses. Cases involving DUI charges were likely to result in an incarcerative sentence: 28.4% of these cases resulted in an incarcerative sentence across races/ethnicities. After controlling for individual and case characteristics, the predicted probability of an incarcerative sentence for DUI cases was 30.9% for Hispanic individuals, 28.3% for Black individuals, and 27.9% for White individuals.
Outcome: Incarceration (Driving Under the Influence (DUI) Offenses)
The results account for differences in individual and case characteristics.
Incarceration by County: In Douglas county, after controlling for individual and case characteristics, the predicted probability of an incarcerative sentence was 10.9% for Hispanic individuals, 10.1% for White individuals, and 9.8% for Black individuals.
Outcome: Incarceration (Douglas County)
The results account for differences in individual and case characteristics.
In Arapahoe county, after controlling for individual and case characteristics, the predicted probability of an incarcerative sentence was 14.3% for Hispanic individuals, 13.7% for White individuals, and 13.1% for Black individuals.
Outcome: Incarceration (Arapahoe County)
The results account for differences in individual and case characteristics.
Conclusion
The fair and just treatment of all individuals at each stage of the criminal justice process is of significant importance. We hope this analysis will prompt a conversation about what systemic drivers of racial/ethnic disparities exist and how the DA's Office might work to address them. We welcome your reflections on the findings and potential next steps.
Terms, Methods, and Limitations
Terms
Case: A collection of charges against a defendant arising out of a single incident. In this analysis, cases are classified by their most serious charge.
Controlling: Taking other factors into account when conducting an analysis. For example, "after controlling for age, gender, criminal history" means that we are taking potential differences in these factors into account when examining the differences between White, Black, and Hispanic defendants.
Predicted Probability: An estimate of the likelihood of the outcome, based on the defendant's race/ethnicity, while taking into account the control variables.
Standard Deviation: A measure of how dispersed the data are in relation to the mean. Low standard deviation means data are clustered around the mean, and high standard deviation indicates data are more spread out.
Methods
Data Source
All data was drawn from the Action case management system, stored and shared by the Colorado District Attorneys' Council (CDAC).
Variable Construction
Race/Ethnicity: As outlined in the data dashboard, race and ethnicity are determined by law enforcement. For this analysis, we combined the race and ethnicity fields. If an individual was identified as White and Hispanic, we categorized them as Hispanic. If the individual's race was identified as Black, we categorized them as Black, regardless of their ethnicity. If the individual's race was identified as Native American, we categorized them as Native American, regardless of their ethnicity. Because we believe that Hispanic individuals were systematically miscategorized as White in the dataset, we used the defendant's last name to help identify their ethnicity. Based on procedures employed by the Colorado Department of Public Safety in their CLEAR Act reporting, we recategorized any individual as Hispanic who met the following criteria: 1) their race was identified as "White," "other," or their race was missing and 2) the 2010 census file (surnames occurring 100 or more times) identified their surname as having 85% or more individuals with that surname as "Hispanic or Latino."
Age: We used the following age categories: under 18, 18–25, 26–35, 36–45, and over 45 years old.
Gender: Law enforcement defines gender in the following categories: male, female, other. Due to the small number of individuals identified as "other," we limited our analysis to individuals identified as male or female.
Criminal History: As outlined in the data dashboard, we calculated criminal history based on convictions (since 2007) within the District Attorneys' Offices participating in the Colorado Prosecutorial Dashboards Project. We developed four categories: a) no criminal history, b) prior misdemeanor convictions, c) prior non-violent felony convictions, and d) at least one prior violent felony conviction. The definition of violent was aligned with the definition used in the dashboard.
Charge Level: Charge represents the most serious filed charge, categorized as a felony or a misdemeanor.
Charge Class: Charge class represents the most serious filed charge, which we categorized as follows: a) felony 1–4 or drug felony 1–3, b) felony 5–6 or drug felony 4, c) misdemeanor 1–2 or drug misdemeanor 1–2, d) misdemeanor 3, or e) traffic misdemeanor 1–2.
Charge Type: As defined in the data dashboard, we classified cases by their top charge into the following categories: person or sex, property, drug, driving under the influence (DUI), traffic, weapons, or other.
Case Length: We calculated the case length as the number of months to case resolution, using the date the case was filed and the date the case was disposed of. We treated values less than zero or more than five years as missing.
Disposition Quarter: To account for time trends, we constructed a categorical variable representing the calendar year quarter the case was disposed.
Felony Declination: We identified all felony referrals for which the DA's Office declined to file charges.
Case Disposition (Dismissal): We identified all cases that had a disposition of "dismissed" for the most serious filed charge. We did not include plea dismissals (a defendant's case/cases dismissed in exchange for pleading guilty to another case/cases).
Case Disposition (Deferred Judgment): We identified all cases for which a defendant received a deferred judgment to the most serious filed charge.
Case Disposition (Plead Guilty): We identified all cases in which the defendant plead guilty to the most serious filed charge.
Charge Reduction: We developed three ordered categories of charge reduction from filing to disposition: a) no reduction; b) within class reduction (for example, a felony 1 to a felony 3 or a misdemeanor 2 to a misdemeanor 4); and c) a charge level reduction (a reduction from a misdemeanor to a petty offense/infraction or a reduction from a felony to a misdemeanor or petty offense/infraction).
Referral Reduced at Charging: Referral charge reduction represents whether the felony referred was reduced to a misdemeanor at point of filing.
Incarceration: As defined in the data dashboard, a sentence to incarceration included any of the following sentences: state prison, youth corrections, community corrections, jail, or any sentence of jail and probation, as well as inmate/outmate programs, work release, in-home detention, and weekenders.
Census Race and Ethnicity
The District's population was generated from information publicly available through the United States Census Bureau. The 2020 U.S. Census collected race and ethnicity as two questions. In combining the race and ethnicity questions, we used the following logic: If an individual identified as White and Hispanic, we categorized them as Hispanic. If an individual identified as Black, we categorized them as Black, regardless of their ethnicity. If an individual identified as Native American ("American Indian or Alaska Native" or "Native Hawaiian and Other Pacific Islander") we categorized them as Native American, regardless of their ethnicity. Because data suggest that individuals who identify as Hispanic often report their race as "some other race" (Pew Research Center), we categorized individuals who identified as "Some Other Race" and Hispanic as Hispanic. We categorized individuals that selected two or more races, regardless of their ethnicity, as "Multiracial or Another Race."
Analytic Sample
This analysis focused on cases received by or filed in the DA's Office from January 2018 through the end of June 2022. We focused on defendants identified as Black, White, and Hispanic. Due to small sample size, we excluded individuals identified as Asian or Native American. We excluded individuals whose race/ethnicity was unknown. To avoid grouping individuals with diverse identities, we also excluded individuals identified as another race/ethnicity.
Analysis Procedures
We conducted all analyses using Stata 17.0 (Statacorps, 2021). We began by conducting descriptive and bivariate analyses, examining the association between race/ethnicity and all outcomes and covariates.
We used logistic regression to examine the association between outcomes (felony declination, dismissed, deferred judgment, plead guilty, and incarceration) and race/ethnicity. For felony declination models, we included gender, age, and criminal history as covariates. For the three disposition (dismissed, deferred judgment, plead guilty) and incarceration models, we included gender, age, criminal history, case length, disposition quarter, charge type, and charge class as covariates.
We used a generalized ordinal logistic regression model to examine the association between charge reduction and race/ethnicity. We selected a generalized ordinal logistic model because the likelihood-ratio test suggested that the proportional odds assumption was violated in the ordinal model. We included gender, age, criminal history, case length, disposition quarter, charge class, charge type, and whether the referral charge was reduced at filing as covariates.
For all models, we conducted stratified analysis, looking for potential differential impacts by charge class, charge type, the top five most frequent charges, gender, age, and county. When presenting results for stratified analysis, we considered categories that had the highest proportion of cases within that outcome (e.g., types of cases most frequently resolved by plea agreement), while aiming to avoid small cell sizes (<50).
To support interpretation, we used the margins command to calculate mean predicted probabilities using the sample values of the other predictor variables. Given sample sizes and equity considerations, we have chosen to report p-value in the technical appendix.
Limitations
- We do not have any charge information (charge class or charge type) for cases that are referrals declined at the point of filing (felony declination). Likewise, we do not have any information as to why the decision was made not to file a case.
- We do not have any information on why cases were dismissed or received a deferred judgment. Likewise, it is not possible to tease out whether cases were dismissed because they were referred to or successfully completed a diversion program.
- We are using a proxy measure of criminal history. As noted on the dashboard, we do not have information on convictions outside the 8 pilot DA Offices participating in the Colorado Prosecutorial Dashboard Project or cases from outside the state of Colorado. Likewise, we only have data since 2007. For these reasons, criminal history may be underestimated. However, when benchmarked against data from the Bureau of Justice Statistics, criminal history was found to be of similar magnitude.
- Race and ethnicity is reported to the DA's Office by law enforcement agencies. Law enforcement currently captures this data through various mechanisms: (1) by linking to prior criminal history records, (2) by scanning a Colorado ID or driver's license, (3) through fingerprint technology, or (4) based on the officer's "perceived demographic information of the person contacted" (as required by HB21-1250). Officer assumptions have the potential to lead to inaccurate or inconsistent data. We have attempted to correct potential under-identification of Hispanic individuals using census data. While we were able to test this correction using a small sample of individuals who self-reported race to Jefferson County Pretrial Services, we have no way to assess to what extent this correction is producing accurate results in the full dataset.
- We were not able to examine outcomes for all racial/ethnic groups. We excluded race/ethnicities which represented less than 2% of the overall defendant population. Likewise, in order to calculate reliable percentages and predicted probabilities, we limited our analyses to groups where there were more than 50 individuals of a particular race/ethnicity.
- We were not able to tease apart guilty pleas in relation to other cases; rather, all cases resulting in a guilty plea are counted individually using the top sentence on each unique case. This likely overstates the actual use of different sentences and could impact our results if having multiple cases is not evenly distributed across racial/ethnic groups.
- While we have considered a number of individual and case-level factors in our analyses, it is not possible to consider all unique aspects of the case. For example, examining charge reduction, we have not examined the types of sentences imposed, which may impact whether a defendant received a charge reduction.
- This analysis was limited in its examination of discretion points. For example, due to lack of data, we have not examined bond decisions, which prosecutors provide input on.