
This analysis considers felonies and misdemeanors filed between March 1, 2020 and June 30, 2022 for individuals identified as White, Black, or Hispanic. Our sample includes 11,301 cases that were disposed of during that time frame. The racial/ethnic breakdown of defendants in our sample was: 72.5% White (8,190), 22.2% Hispanic (2,504), and 5.4% Black (607).
Case outcomes. Of the cases in our sample, 55.8% were resolved through plea agreements, 17.0% through dismissal, 14.0% through deferred judgments, 12.4% through a global plea, and 0.8% through a trial. Systematic data on other outcomes, such as diversion, are not available.
Differences Among Defendants. There were some differences among defendants. Hispanic and Black individuals were younger than White individuals. White individuals were less likely to have a criminal history. Black individuals had higher rates of having cases involving a felony charge (vs. misdemeanor) filed. It took longer to resolve cases for Black individuals.
More on differences among defendants
A case is dismissed when the criminal charges are terminated, either by the court or by the prosecutor. There can be several reasons why a case is dismissed, including: a lack of evidence or unavailability of a witness. Cases may also be noted as dismissed if they are referred to, or successfully complete, a diversion program.
Total Dismissed: Our sample included 1,917 cases that were dismissed. Dismissals accounted for 17.0% of case dispositions in the sample. Overall, 20.3% (123) of cases involving Black individuals, 16.8% (1,376) of cases involving White individuals, and 16.7% (418) of cases involving Hispanic individuals were dismissed. These represent raw rates: any differences we see could be due to differences in individual or case characteristics.
Outcome: Dismissal (All)
The results account for differences in individual and case characteristics.
16.8%
20.6%
16.5%
Predicted Probability of Dismissal: After controlling for defendant age, gender, criminal history, case length, disposition quarter, charge type, and charge class, the predicted probability of a case resulting in a dismissal was 20.6% for Black individuals, 16.8% for White individuals, and 16.5% for Hispanic individuals. These estimates aim to take into account potential differences in individual or case characteristics.
Dismissals and Case Length: The longer a case took, the higher the likelihood of dismissal. Recall that it took longer to resolve cases for Black individuals.
To further explore potential differences across races/ethnicities we zoomed in on dismissals by charge level (misdemeanors) and dismissals by the charge type most frequently dismissed: traffic.
Dismissals by Charge Level: Cases involving a misdemeanor charge were more likely to result in a dismissal (20.2%) than cases involving a felony charge (6.7%). For misdemeanors, after controlling for individual and case characteristics, the predicted probability of dismissal was 24.8% for Black individuals, 20.0%for White individuals and 20.0% Hispanic individuals.
Dismissals for Traffic Offenses: Cases involving traffic charges were more likely to result in a dismissal: 25.4% of these cases were dismissed across races/ethnicities. After controlling for individual and case characteristics, the predicted probability of dismissal was 32.6% for Black individuals, 26.7% for Hispanic individuals, and 24.5% for White individuals.
A deferred judgment is an alternative to traditional prosecution that attempts to address individuals’ needs and to offer alternatives such as useful public service, probation, payment of restitution, or counseling or treatment related to their case. The defendant enters a temporary guilty plea, and, if they comply with the terms, their guilty plea is withdrawn and the case is dismissed. If an individual does not comply with the terms of their deferred judgment, the temporary guilty plea becomes permanent, and they are then sentenced.
Total Deferred. Our sample included 1,586 cases that were deferred. Deferrals accounted for 14.0% of case dispositions in the sample. Overall, 14.2% (1,162) of cases involving White individuals, 14.1% (353) of cases involving Hispanic individuals, and 11.7% (71) of cases involving Black individuals were deferred. These represent raw rates: any differences we see could be due to differences in individual or case characteristics.
Outcome: Dismissal (All)
The results account for differences in individual and case characteristics.
17.8%
19.3%
16.3%
Predicted Probability of Deferral: After controlling for defendant age, gender, criminal history, charge class, charge type, case length, and disposition quarter, the predicted probability of a case resulting in deferral was 14.4% for White individuals, 14.2% for Hispanic individuals, and 9.5% for Black individuals. These estimates aim to take into account potential differences in individual or case characteristics.
To further explore potential differences across races/ethnicities we zoomed in on deferrals by charge level (misdemeanors).
Deferrals by Charge Level: A similar percent of cases involving either a misdemeanor or a felony charge resulted in deferral, 15.4% and 13.6% respectively. For misdemeanors, after controlling for individual and case characteristics, the predicted probability of deferral was 13.9% for Hispanic individuals, 13.8% for White individuals, and 9.7% for Black individuals.
An individual pleads guilty when they admit a factual basis for the plea and acknowledge guilt for a charge, sometimes in exchange for a more lenient sentence.
Total Plead Guilty: Our sample included 6,310 cases that resulted in a guilty plea. Guilty pleas for 55.8% of case dispositions in the sample. Overall, 56.4% (1,411) of cases involving Hispanic individuals, 56.0% (4,584) of cases involving White individuals, and 51.9% (315) of cases involving Black individuals resulted in a guilty plea. These represent raw rates: any differences we see could be due to differences in individual or case characteristics.
Outcome: Dismissal (All)
The results account for differences in individual and case characteristics.
55.6%
56%
56.6%
Predicted Probability of Pleading Guilty. After controlling for defendant age, gender, criminal history, charge class, charge type, case length, and disposition quarter, the predicted probability of a case resulting in a guilty plea was 56.6% for Hispanic individuals, 56.0% for Black individuals, and 55.6% White individuals. These estimates aim to take into account potential differences in individual or case characteristics.
Plead Guilty and Case Length: The longer a case took, the lower the likelihood of a case resulting in a guilty plea. Recall that it took longer to resolve cases for Black individuals.
To further explore potential differences across races/ethnicities we zoomed in on guilty pleas by charge level (misdemeanors and felonies) and guilty pleas for a charge type likely to be plead to: traffic offenses.
Plead Guilty by Charge Level: Cases involving a felony charge were more likely to result in a guilty plea (65.1%) than cases involving a misdemeanor charge (52.9%). For felonies, after controlling for individual and case characteristics, the predicted probability of a case resulting in a guilty plea was 68.2% for Black individuals, 68.1% for Hispanic individuals, and 64.0% for White individuals.
For misdemeanors, after controlling for individual and case characteristics, the predicted probability of a case resulting in a guilty plea was 53.2% for Hispanic individuals, 52.9% for White individuals, and 51.7% for Black individuals.
Plead Guilty for Traffic Offenses: Cases involving traffic charges were likely to result in a guilty plea: 61.3% of these cases resulted in a guilty plea across races/ethnicities. After controlling for individual and case characteristics, the predicted probability of a guilty plea was 62.2% for White individuals, 59.4% for Hispanic individuals, and 56.9% for Black individuals.
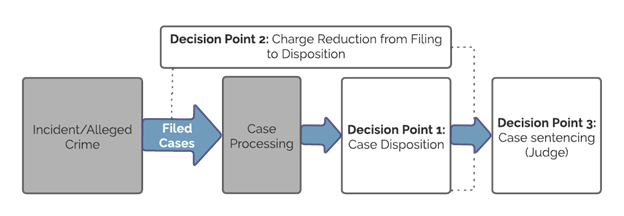
After a prosecutor files a case, the top charge in the case may change over time as some charges are dismissed or amended between filing and disposition. In this section, we considered reductions in the severity of charges from initial filing to disposition for cases that plead or were found guilty.
Total Charge Reduction: Of the 6,310 cases that resulted in a guilty plea, 34.3% had no charge reduction, 23.5% had a within charge level reduction (either from a more severe felony to a less severe felony, or from a more severe misdemeanor to a less severe misdemeanor), and 42.2% were reduced across charge levels (from a misdemeanor to a petty offense/infraction or from a felony to misdemeanor or petty offense/infraction). Overall, the breakdown across racial/ethnic groups was:
- No reduction: 34.9% White (1,599), 34.2% Hispanic (482), and 27.3% Black (86).
- Within charge level reduction: 27.1% Hispanic (383), 24.1% Black (76), and 22.3% White (1,022).
- Across charge level reduction: 48.6% Black (153), 42.8% White (1,963), and 38.7% Hispanic (546).
Outcome: No Charge Reduction (All)
The results account for differences in individual and case characteristics.
34.1%
32.5%
35.9%
Predicted Probability of Charge Reduction: After controlling for defendant age, gender, criminal history, charge class, charge type, case length, and whether the referred charge was reduced at filing, the predicted probability of no charge reduction was 35.9% for Hispanic individuals, 34.1% for White individuals, and 32.5% for Black individuals.
The predicted probability of a within charge level reduction was 26% for Hispanic individuals, 22.8% for White individuals, and 20.7% for Black individuals.
The predicted probability of across charge level reduction was 46.8% for Black individuals, 43.1% for White individuals, and 38.1% for Hispanic individuals. These estimates aim to take into account potential differences in individual or case characteristics.
After an individual is found guilty of a crime, a judge imposes a sentence which may include fees, fines, community service, probation, jail, community corrections, or prison. Prosecutors and defense attorneys can negotiate plea bargains or make sentencing recommendations to the judge, who decides on the ultimate sentence. Incarceration includes any jail sentence (with or without probation), community corrections, or prison.
Total Incarceration: Of the 6,310 cases that resulted in a guilty plea, 18.8% had an incarcerative sentence. Overall, 21.9% (69) of cases involving Black individuals, 21.6% (305) of cases involving Hispanic individuals, and 17.8% (815) of cases involving White individuals resulted in an incarcerative sentence. These represent raw rates: any differences we see could be due to differences in individual or case characteristics.
No Charge Reduction
The results account for differences in individual and case characteristics.
18%
18.8%
21.4%
Predicted Probability of Incarceration: After controlling for defendant age, gender, criminal history, charge class, charge type, case length, and disposition quarter, the predicted probability of incarceration was 21.4% for Hispanic individuals, 18.8% for Black individuals, and 18.0% for White individuals. These estimates aim to take into account potential differences in individual or case characteristics.
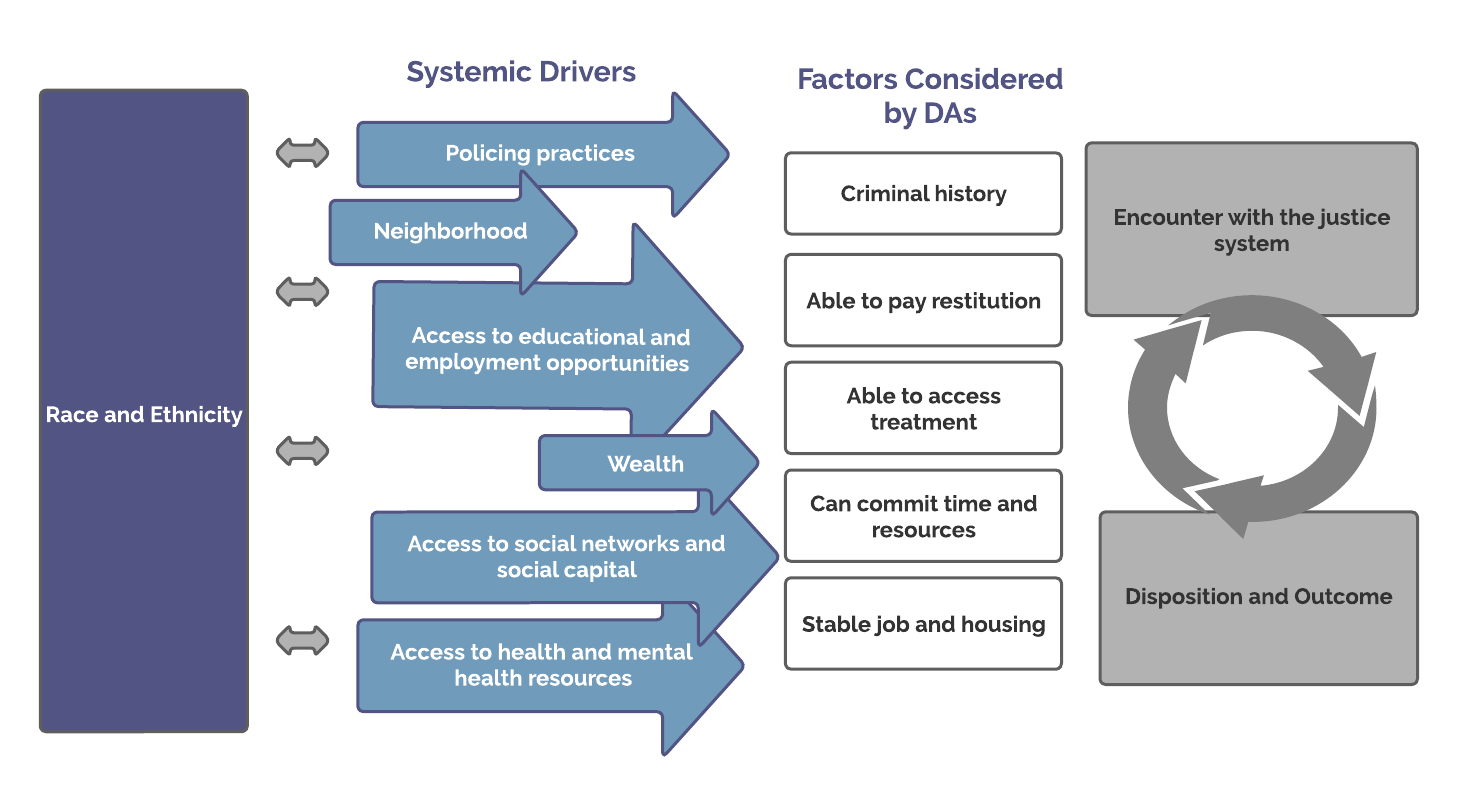
The fair and just treatment of all individuals at each stage of the criminal justice process is of significant importance. We hope this analysis will prompt a conversation about what systemic drivers of racial/ethnic disparities exist and how a DA’s Office might work to address them. We welcome your reflections on the findings and potential next steps.